Monitor your external APIs with AWS Cloudwatch - Synthetics Canaries
Learn how and why you should start using AWS cloudwatch Sythetics Canaries for your monitoring needs.

What is it?
One of the easiest metrics to check if your application is running is to see if it is loading properly and that all its features are working fine. There are many monitoring tools like Zabbix, Nagios, DataDog etc that allows us to do this. To add on to that and with more customisability with the usage of Lambda, the AWS cloudwatch Sythetics Canaries is an exceptional monitoring service to monitor custom APIs or websites.
AWS Synthetics Canaries actually use Lambda in the background with selenium or puppeteer scripts to do the monitoring. Previously, we had to set up a cloudwatch event, set up Lambda, write custom code for the Lambda and then the Lambda had to push the metrics or logs to cloudwatch. Synthetics Canaries simplifies this entire process and makes the configuration of API or web monitoring easy with just a coouple of clicks.
Why I used this?
I had to use this service because I had a requirement from my customer to monitor the TAT (Turn Around Time) of an external API for an application running in AWS in a VPC with external calls going through a Managed NAT. From that, I had 3 ways to do it.
- Zabbix web check
- Zabbix user parameter
- AWS Cloudwatch Synthetics Canaries
I tested each of the methods and provided the pros and cons with each method and following were my findings.
Zabbix web check
Zabbix has an option to do web check wherein we can create steps and configure the method, URL, data, headers and other parameters of an HTTP request and use that to monitor the retured response, status codes, latency etc.
One issue I found with this method is that in Zabbix, the webcheck is done from the Zabbix server itself (or proxy server if the host having the webcheck is monitored by a proxy), this means that the people running the external API has to allowlist the Zabbix server IP also which is an additional step. We also skip the route via the Managed NAT which is being used by the rest of the application servers.
So this methods was not recommended
Zabbix user parameter
In this method, a custom user parameter is added to any one of the application server. User parameter is a specific custom key that can be monitored by Zabbix. This is configured in the Zabbix agent of the host which we will add the monitoring item to.
The user parameter is a custom script or command that gives the required output which can then be used directly or parsed by Zabbix.
In this case, we will be using the following curl command to get the total time or latency of the API request as a float value.
curl -w "%{time_total}\n" -o /dev/null -s "https://vigneshn.in/"One advantage with this method is that the request will go through the NAT gateway since the command is run from the application server running in the VPC
The problem with this method is that the configuration for this exists in the Zabbix server and a specific application server in which that user parameter is configured. This is a problem if that application server goes down or if there is an infrastrucutre or application change that makes that server obsolete. This also will be a problem considering that running that command will use some CPU, memory and network of the application server.
So this method was also not recommended.
AWS Cloudwatch Synthetics Canaries
Since both the above solutions had their own specific technical limitations, AWS Cloudwatch Synthetics Canaries was tested.
In this case, it was configured through the AWS console by entering the required API URL, data, headers etc. and it was complete. I was able to configured the VPC, Subnet, Security group etc which the backend Lambda should use and this means that the request will always go through the NAT gateway which shows the latency via NAT and also no additional IP has to be allowed in the external API.
Since this does not depend on any of the internal servers, any downtime in them will not affect the monitoring. Since two subnets were selected in different availability zones, even if an availability zone goes down, the monitoring will still work.
The only problem with this is the additonal cost associated with this, but it is negligible.
How to set up the Synthetics Canaries
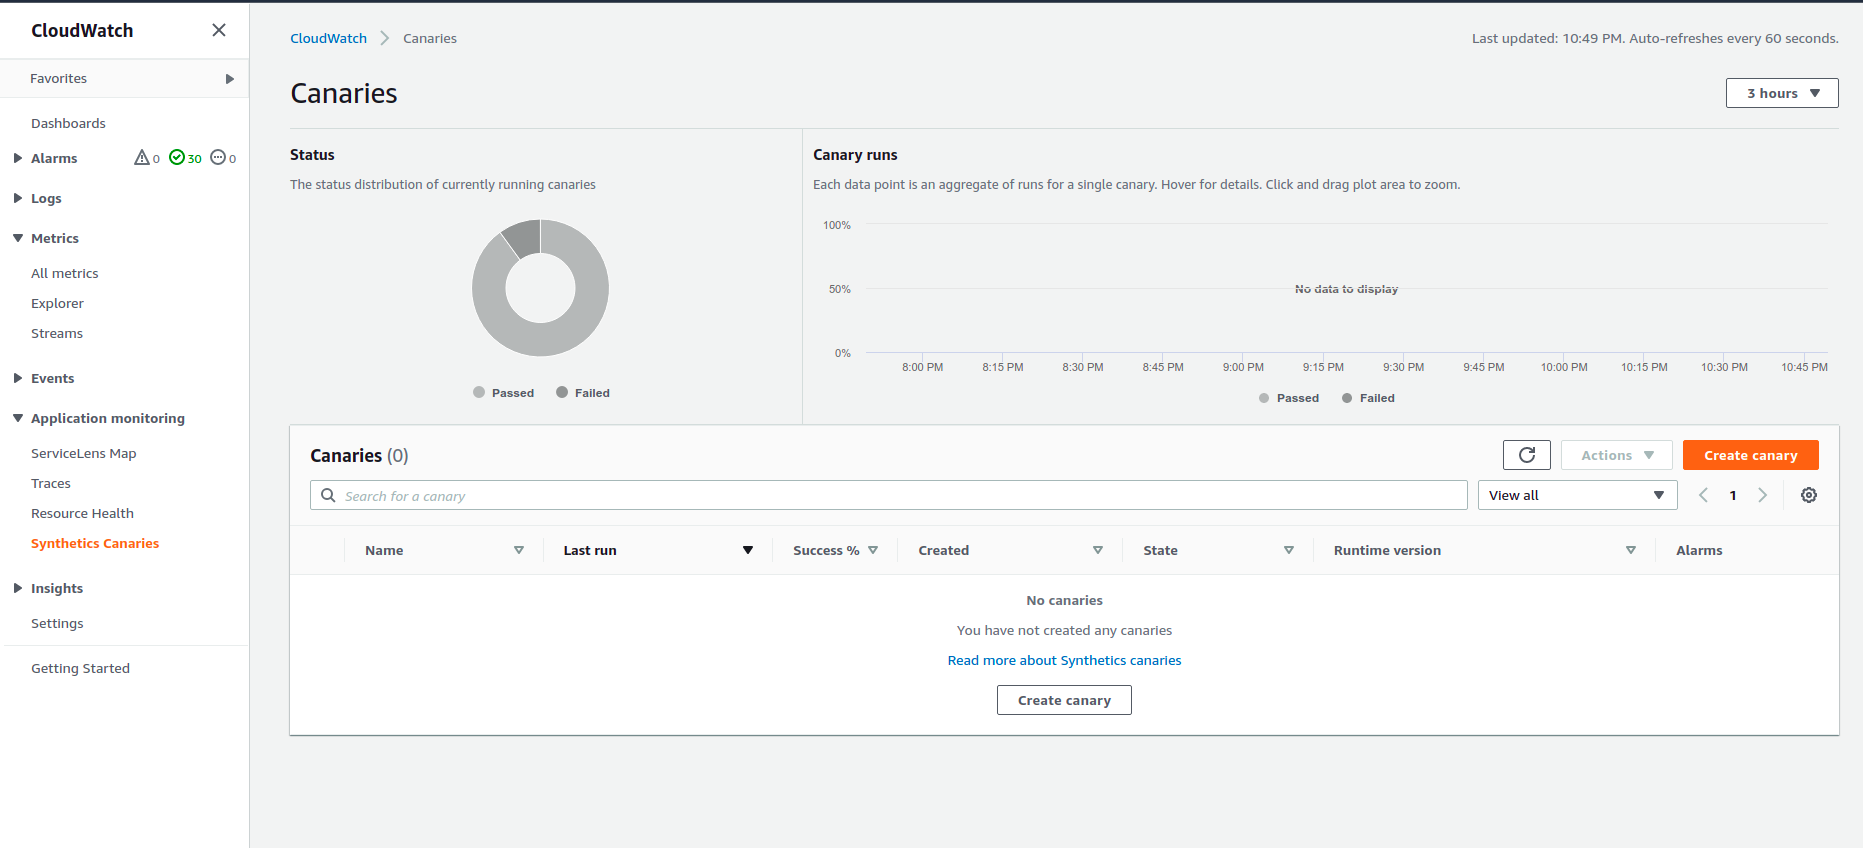
First open the cloudwatch dashboard and on the left bottom, there is an option named Synthetics Canaries. Clicking that will open up the Canaries page with the status dashboard. Here, click on Create canary button
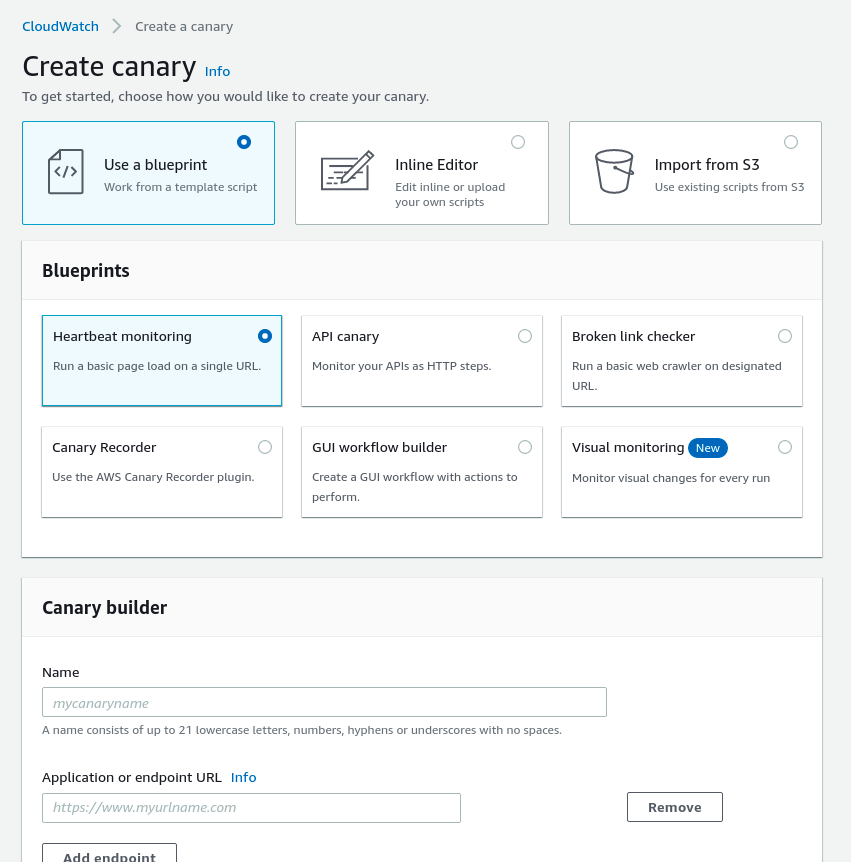
When you click the Create canary button, you'll be presented with the options on how to create it. You can use a blueprint (easy method), you can use an inline editor (customisable with your own scripts) or you can load the scripts from S3.
There are some typically used monitoring methods in the "Use a blueprint" option like Heartbeat monitoring, API canary, Broken link checker etc.
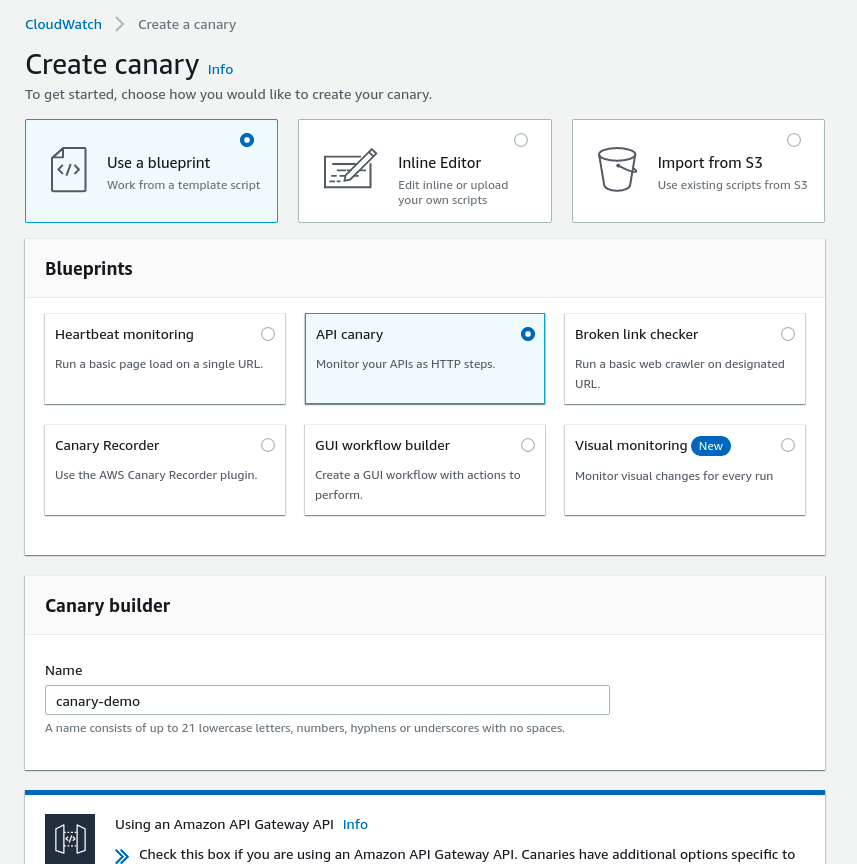
In our case, we will be using the API canary option since we are planning to check the latency of an API call. I have also put a name for the canary as "canary-demo".
Now it is time to set the configuration for the API call. As an example, I am just sending a GET request to https://www.google.com with two required headers (Otherwise we will get bad request as the response).
Method: GET
URL: https://www.google.com
Headers:
	- user-agent : curl/7.74.0
    	- accept : */*
You also have an option to put request data but we are skipping it in this example.
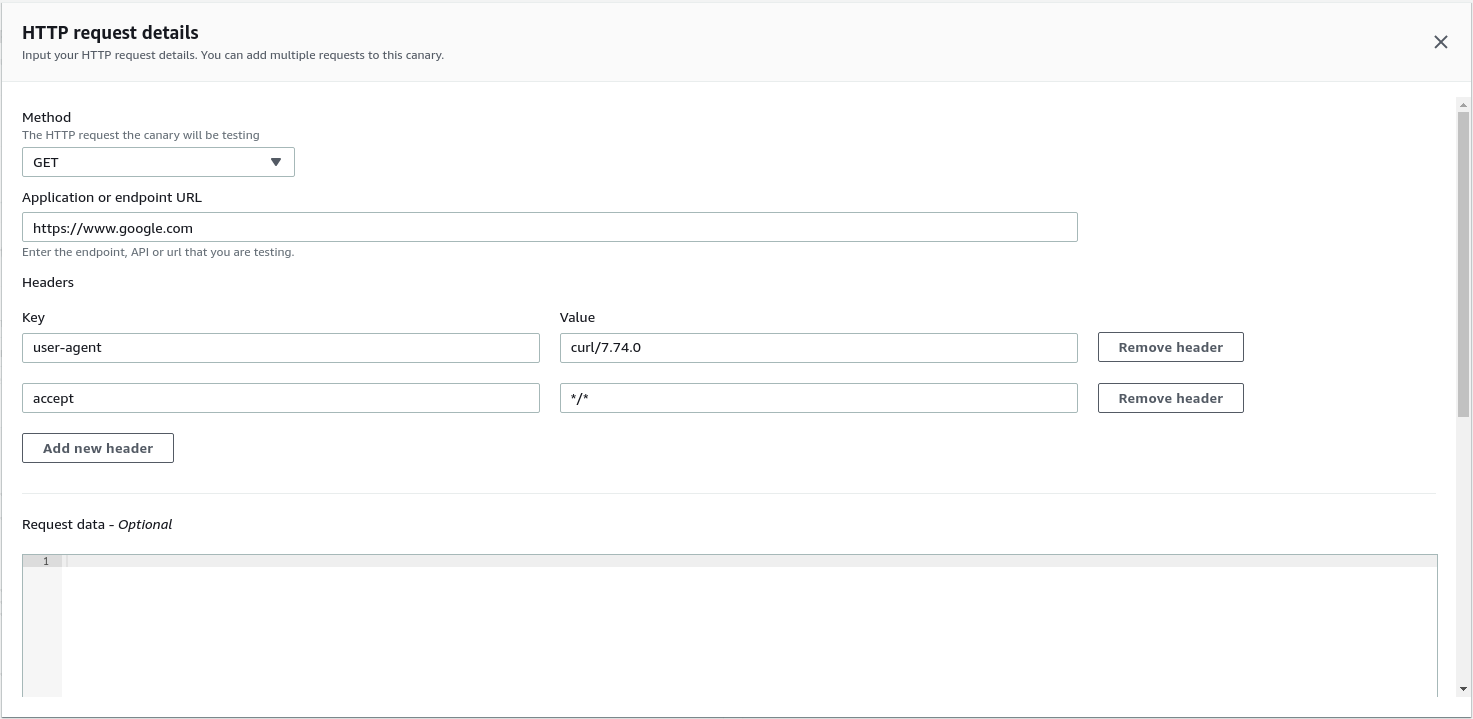
If you are putting sensitive header like Authorization, the console will highlight it in red and show a button below to redact that information from coming in the logs, HAR etc. You can press that button or create the canary as is depending on your requirements.
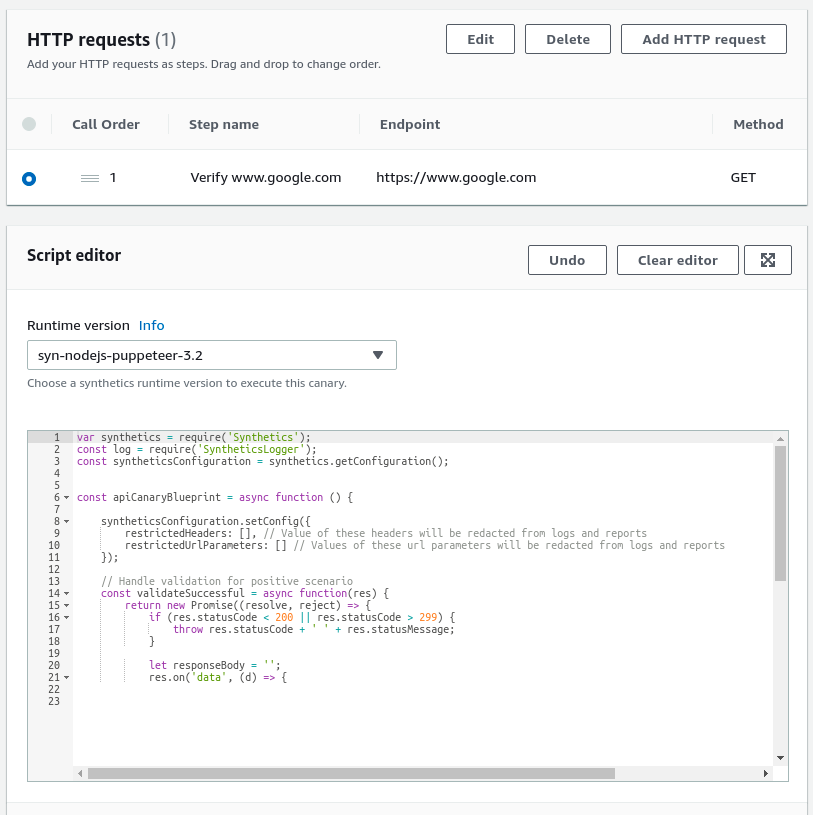
Once you have set up the HTTP request, you can choose the Runtime version. I am using sys-nodejs-puppeteer-3.2 but it is only signifincant if you are modifying the script before running. In that case, you can choose the required language.
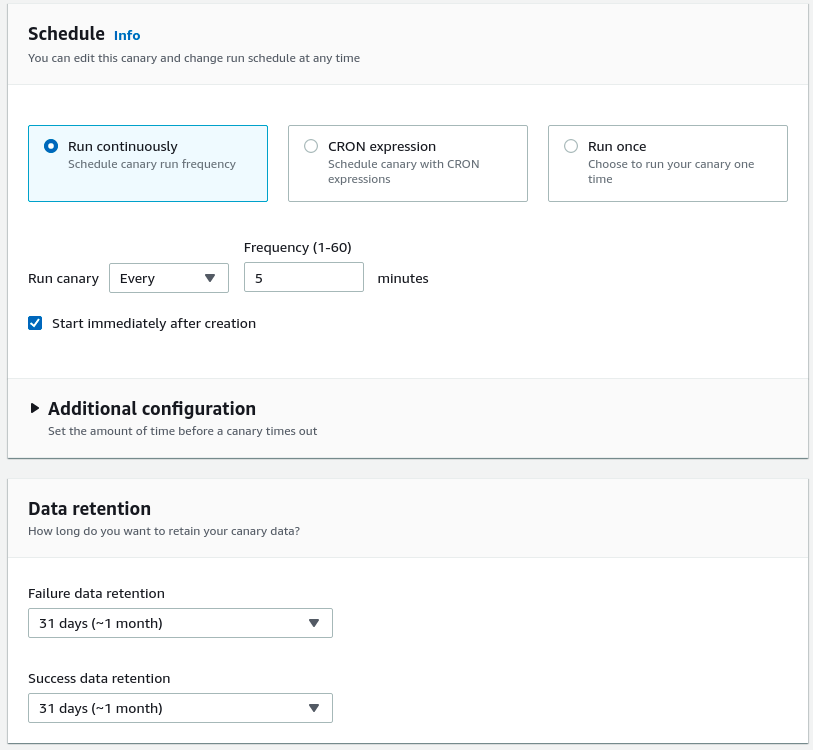
Now it is time to choose the schedule to tell the Sythetics Canary how frequently or at what time it should run. You can set it to run continously one a specific date or at regular intervals of time, you can put in a CRON expression, or you can run it only once.
In my case, I am choosing the "Run continously" option because I'm lazy to find the cron expression. I always forget the format.
I am also checking the option to start it immediately after creation.
There are some additional configuration also to set a timeout but I am leaving it as is.
There is also an option to specify how long the failure data and the success data should be retained. I am putting it as 1 month for both success and failure data.
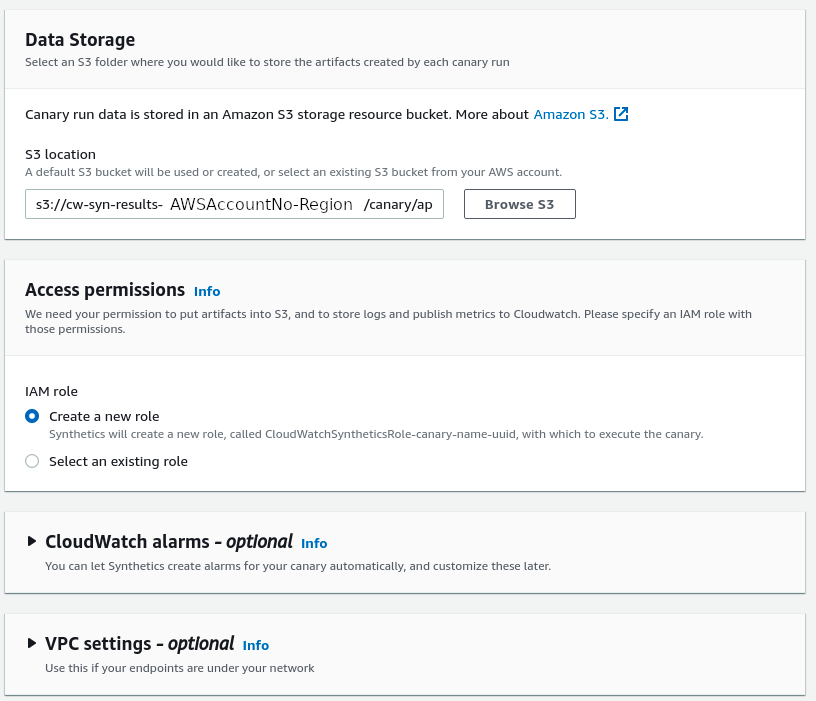
The data that is collected during each canary run is stored in an S3 bucket. By default, an S3 bucket will be created with the format given in the screenshot
s3://cw-syn-results-AWSAccountNumber-Region/canary/...You do have the option to change it but that will require you to already have set up an IAM role with the correct permission to write to that S3 bucket.
You can either configure the canary to create a new role or select and existing role in the next "Access permissions" step. Do note that once the S3 bucket is edited, then the "Create a new role" option will not be selectable.
You can also create CloudWatch alarms which I am skipping now but it is required if you need to get alerts when the API latency crosses a set threshold.
As I said perviously, my requirement had to have the lambda call the external API from within the VPC since the application servers were inside the VPC and they were sending the request through the NAT.
In this case I am not configuring the VPC for this demo because I configured google.com as the API endpoint and since it is in the public internet, I will need a NAT in the VPC since lambda can talk to public internet from inside the VPC only if there is a NAT gateway attached and as AWS managed NAT gateways are friggin expensive.
When you are giving a custom S3 location, you have to create a service role for Lambda with the following configurations
Path
/service-role/IAM Policy
{
    "Version": "2012-10-17",
    "Statement": [
        {
            "Effect": "Allow",
            "Action": [
                "s3:PutObject",
                "s3:GetObject"
            ],
            "Resource": [
                "arn:aws:s3:::{bucketname}/{path}/*"
            ]
        },
        {
            "Effect": "Allow",
            "Action": [
                "s3:GetBucketLocation"
            ],
            "Resource": [
                "arn:aws:s3:::{bucketname}"
            ]
        },
        {
            "Effect": "Allow",
            "Action": [
                "logs:CreateLogStream",
                "logs:PutLogEvents",
                "logs:CreateLogGroup"
            ],
            "Resource": [
                "arn:aws:logs:ap-northeast-1:038218625917:log-group:/aws/lambda/cwsyn-{canaryname}-*"
            ]
        },
        {
            "Effect": "Allow",
            "Action": [
                "s3:ListAllMyBuckets",
                "xray:PutTraceSegments"
            ],
            "Resource": [
                "*"
            ]
        },
        {
            "Effect": "Allow",
            "Resource": "*",
            "Action": "cloudwatch:PutMetricData",
            "Condition": {
                "StringEquals": {
                    "cloudwatch:namespace": "CloudWatchSynthetics"
                }
            }
        }
    ]
}
Trust relationship
{
  "Version": "2012-10-17",
  "Statement": [
    {
      "Effect": "Allow",
      "Principal": {
        "Service": "lambda.amazonaws.com"
      },
      "Action": "sts:AssumeRole"
    }
  ]
}
If you are providing VPC configurations to make requests from inside your VPC, remember to also attach the AWSLambdaVPCAccessExecutionRole to the created IAM Role. This is required by the Lambda running in the backend of the Synthetics Canaries to create network interfaces inside the VPC with the given configuration.
Now you can tag the canary and if you want, you can also enable Active tracing with AWS X-Ray. I am keeping mine checked.
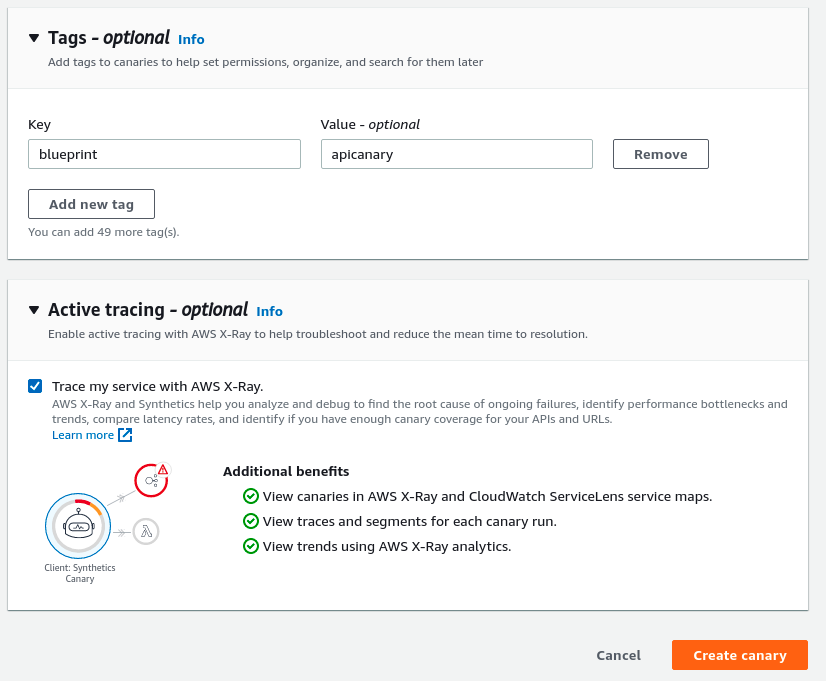
That is it, you can click the Create canary button as you see in the above screenshot and your canary will be created. You will be able to see the failure and success status in the canary dashboard.
If you make any mistakes, you have the option to edit the configuration after the entre thing is created.